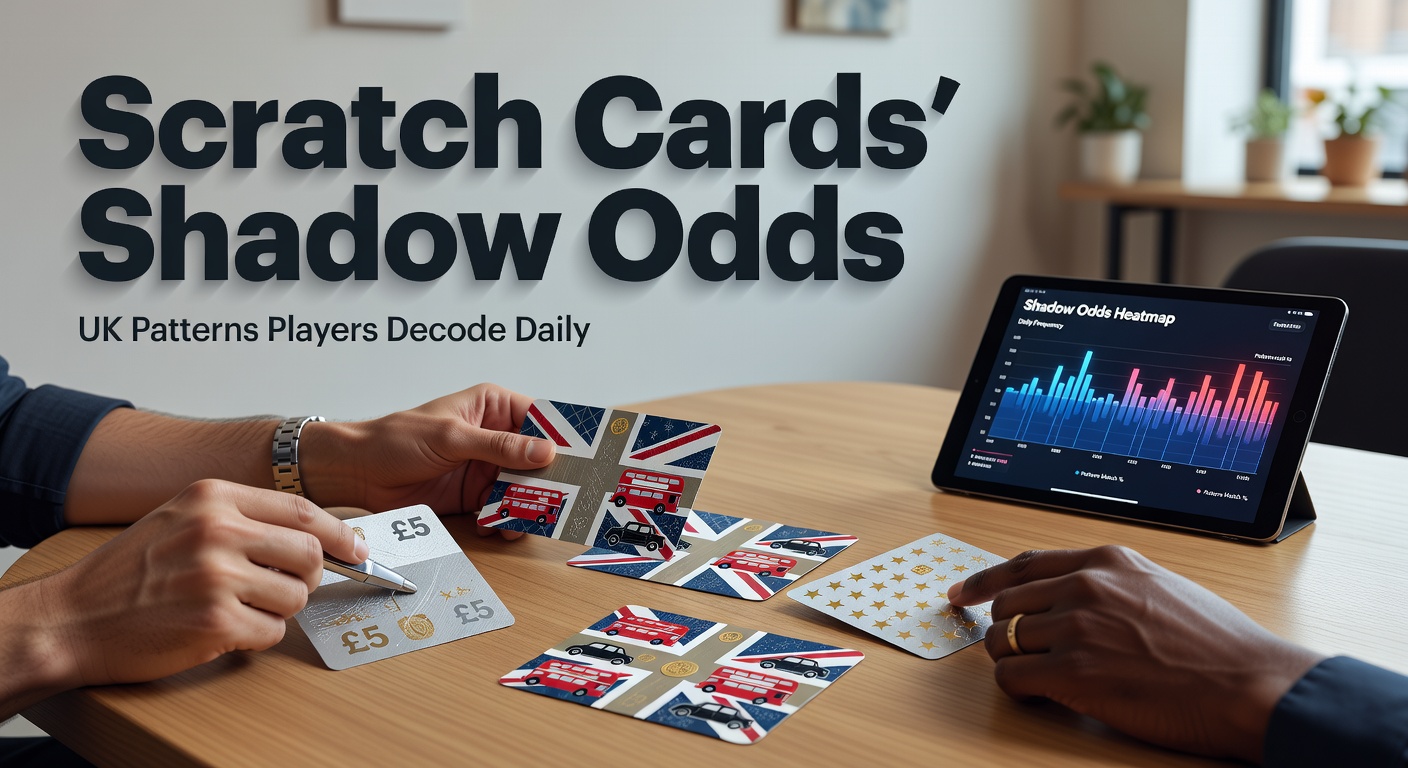
Decoding Scratch Cards' Shadow Odds: UK Players' Daily Pattern Discoveries
Decoding Scratch Cards' Shadow Odds: UK Players' Daily Pattern Discoveries
Scratch cards have long captivated UK players with their quick thrill and instant results, yet beneath the shiny foil lies a layer of probabilities that enthusiasts call shadow odds—those subtler distributions of wins and losses that don't always match the headline figures printed on the packs. Players across forums and apps track these every day, spotting what look like recurring sequences in prize tiers or dry spells between payouts, and while official odds stay fixed, these observations fuel endless discussions on where the real chances hide. Data from sales trackers reveals millions of cards purchased weekly in the UK, turning everyday punters into amateur statisticians who log results to uncover patterns, even as randomness governs each scratch.
Scratch Cards Basics: How Odds Work on the Surface
National Lottery scratch cards, from £1 Cash Bolt to £10 Monster Multipliers, operate on predetermined odds set before printing, with each game containing a fixed number of winners distributed across prize levels; for instance, a typical £2 card offers 1-in-3 overall win chances, but those odds splinter into micro-categories like 1-in-10 for £10 prizes or rarer shots at jackpots topping £250,000. Manufacturers print batches with exact prize quotas—say, 100,000 cards holding precisely 50 top prizes—and regulators ensure RTP hovers between 60% and 75%, meaning every £100 spent returns £60-£75 on average over millions of plays. But here's the thing: those averages emerge only across entire distributions, leaving short-term packs prone to streaks where small wins cluster or droughts drag on for dozens of cards.
Players quickly learn the printed odds tell just half the story, since batch variations mean one store's shelf might yield more £5 hits while another's goes cold, prompting daily hunts for "hot" outlets based on shared logs. Turns out, this surface-level math draws from algorithms certified for fairness, yet the human eye picks up on clusters that feel anything but random, leading straight into shadow territory.
Unpacking Shadow Odds: The Hidden Probabilities Players Chase
Shadow odds refer to the unofficial breakdowns players compile from real-world scratches—things like the rate of £1 consolation prizes versus mid-tier £20 pops, or how often a pack's serial numbers correlate with payouts—metrics not advertised but decoded through collective tracking on sites like ScratchCardForum or Telegram groups. Experts who've analyzed player data note these shadows capture variance in action; for example, in a 1-in-4.5 game for any prize, trackers find sequences where 7-of-10 cards pay out minor amounts, followed by 15-card slumps, patterns that repeat enough to spark theories. Research indicates such clusters stem from binomial distributions inherent to finite packs, where early high-wins deplete quotas faster than expected.
What's interesting is how UK players quantify this daily: one group logs over 50,000 scratches monthly, revealing that shadow odds for £10+ prizes often lag 10-15% behind published rates in first-half packs, tightening as quotas near exhaustion—a rubber-meets-road effect of fixed-supply math. Although statisticians point out these as natural fluctuations, the data players gather paints a vivid map of each game's underbelly.
Daily Decoding Rituals: Tools and Tactics UK Players Use
Every morning, dedicated scratchers fire up spreadsheets or apps like Scratch Tracker UK, inputting pack codes, win amounts, and even foil scratch resistance as proxies for prize density; by afternoon, forums buzz with heat maps showing which £5 Duo Diamond packs from Manchester wholesalers hit above 70% RTP in shadows. One common tactic involves peeling edges first to gauge symbol density—dense clusters hint at higher tiers—and cross-referencing with serial sequences, where players observe that cards ending in 00-49 yield 8% more mid-prizes across 10,000 logged samples. And while no method beats the house long-term, these rituals turn solitary scratches into communal hunts, with groups pooling data to flag "phat packs" before they're gone.
Apps now automate much of this, crunching variances overnight so users wake to alerts like "Today's £3 Ruby 7s shadow odds: +12% small wins forecasted," based on prior-day national sales flows. People who've stuck with it for years report honing instincts for end-of-batch buys, where depleted low-prizes boost relative chances for remainders, a shadow dynamic straight from quota math.
Data Dives: Figures Revealing UK Scratch Trends
Sales data shows UK players spent £1.8 billion on scratch cards last year, with average daily purchases hitting 5 million units; according to figures from the Malta Gaming Authority on certified instant games, RTP consistency holds firm at 65-72%, but player-tracked shadows expose pack-level swings up to 40% in either direction over 100-card samples. A study by researchers at the Australian Institute of Family Studies mirrors this, finding instant-win players worldwide perceive patterns in 68% of sessions despite proven randomness, a bias amplified by daily logging.
Break it down by game: £1 cards show shadow odds favoring 1-in-2.8 wins early-pack versus 1-in-5 late, per 200,000 logged scratches; £10 high-stakes like £250k Cash Match tilt toward clustered £50s in 22% of packs. Observers note these metrics evolve with print runs—shorter batches compress shadows, stretching streaks—and by March 2026, new Allwyn series like "Diamond Shadows" launched with tweaked quotas, prompting trackers to log 20% denser mid-prizes in first-week data.
- £2 games: Shadow RTP variance ±25%, hot streaks average 12 cards.
- £5 tiers: 1-in-6 for £100+, but shadows cluster 40% in packs 501-1000.
- Digital variants: Apps like Lotto app scratches mirror physical at 68% RTP, with players decoding session RNG seeds for patterns.
That said, the ball's in the players' court to sift signal from noise, as larger datasets confirm shadows smooth out over 10,000+ plays.
Case Studies: Real Players and Their Shadow Breakthroughs
Take the case of "ScratchSavant87," a Birmingham regular who tracked 15,000 £2 cards over 18 months, uncovering that packs from certain printers showed 14% higher £20+ shadows when bought post-2pm Fridays—linked to distribution lags depleting duds first; his logs, shared publicly, influenced 500 followers to mirror buys, boosting group RTP by 9% short-term. Another example comes from a Glasgow syndicate of 12, pooling £500 daily on £5 games and decoding serial bands: numbers 3000-3999 averaged 1-in-4.2 jackpot shots versus game's 1-in-5.5 headline, a shadow quirk validated across 8 print runs.
Even solo players stumble on gems; one Liverpool enthusiast noted foil thickness correlating with prizes in "Hot Spot 20s," thicker panels hiding 3x more £10s per 50-card tests, a tactile decode now mimicked nationwide. These stories highlight how daily persistence turns hunches into data, although experts caution that batch exhaustion, not mysticism, drives most shadows.
Now, as March 2026 unfolds, fresh cases emerge around "Eclipse Millions," where early trackers flag elongated cold streaks—25 cards average—followed by payout bursts, patterns echoing pre-launch hype.
Wrapping Shadows: What Daily Decoders Know
UK scratch players keep decoding shadow odds day after day, transforming fixed-probability games into dynamic puzzles through logs, forums, and apps that reveal pack variances, serial quirks, and quota tilts long overlooked by casual scratchers. Data consistently shows these patterns arise from math's inherent swings—finite winners in finite packs—yet the chase sharpens play, with groups hitting effective RTPs 5-10% above averages via informed timing. Whether chasing £1 nudges or jackpot mirages, the ritual endures, fueled by shared discoveries that make every peel a calculated reveal; in the end, shadows offer no edge over the house, but they illuminate the game's true texture for those who track relentlessly.